CURRENT BEND OREGON REAL ESTATE STATISTICS FOR APRIL 2023
PLEASE NOTE- I CAN CREATE BEND OREGON REAL ESTATE STATISTICS FOR YOU BASED ON ANY CRITERIA YOU WISH!
– Land sales, a certain price range, size of home, a certain zip code, a certain neighborhood, new homes only, and so on. EMAIL ME AND I’LL CUSTOMIZE BEND OREGON REAL ESTATE STATISTICS JUST AS YOU’D LIKE!
THE CRITERIA I USE FOR THESE CHARTS:
These are types of Bend homes the majority of my home buyers actually buy.
Zip codes 97701, 97702, and 97703 which encompasses all of Bend proper.
3 bedroom, 2 bath minimum
1500 square feet minimum to 3500 maximum
Maximum of 3 acres
Residential Resale and New Construction Single Family Homes
Bend Real Estate Sales Statistics
Bend Oregon real estate statistics- Average Bend Home Prices
SO, I haven’t done statistics here for almost 4 years. WHY? Well, thank the Bend Oregon MLS, as they switched service providers. The new one is much less robust in terms of making statistical charts (it won’t, at all), and the data is not nearly as customizable as it was before.
As it was really too busy the last few years to keep up with the site anyway, I scratched my head and gave up. But now, as business has returned to some sort of sanity, I want to put something up for people to understand where we are in terms of pricing, so I’m giving it a shot, albeit without the colorful charts of the past. Once I collect enough numbers over the next year, providing the Bend real estate business doesn’t explode again, I’ll be able to make my own charts via spreadsheets. I made one here, but it ain’t that great- I’ll get better!
So, in order to give a good look at actual numbers, I am using 90 days of data to get a durable average for that time period. SO, what we have below is a snapshot of where prices have gone since the FED started raising rates to slow down home sales (which worked, BTW), ginv you a glimpse of how much prices have dropped, or in a couple of cases, increased, in the past year.
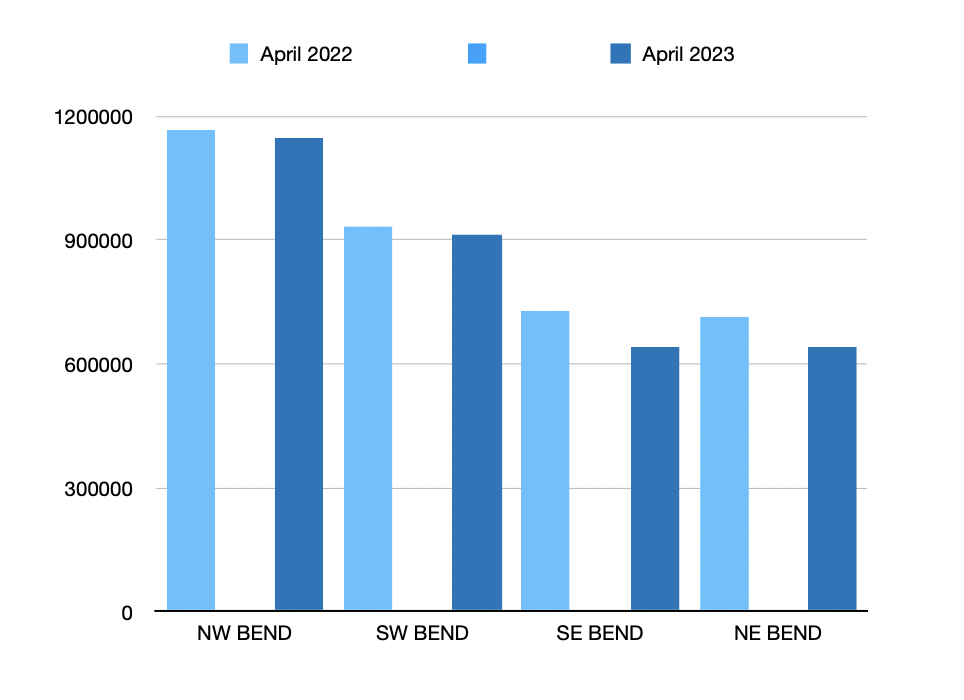
Bend Oregon Real Estate Statistics – April 2022 vs April 2023
As you can see, Bend real estate prices are down over the past year, but not by much. In fact the west side is barely down at all, and overall we are down about as much as San Francisco (7.6%), and Seattle (5.1%), year over year. Prices are further down on the east side, especially the SE side, as builders are constructing tons of new homes in those areas, which are most of the market there at this point, and the majority of them are starter homes. As always, I have broken these down into the four quadrants of town, so you can see how much each is down, or up.
AVERAGE SOLD PRICES FOR 3 MONTHS LEADING UP TO APRIL 1
2022 2023 CHANGE%
BEND OVERALL- $880,936 $816,915 – 7 %
NW BEND- $1,164,852 $1,147,789 – 1 %
SW BEND- $931,833 $914,884 – 1 %
SE BEND- $726,837 $641,813 -11%
NE BEND- $715,259 $642,432 -10%


